Summary:
"ELK" is the acronym for three open source projects: Elasticsearch, Logstash, and Kibana.
Elasticsearch is a search and analytics engine.
Logstash is a server-side data processing pipeline that ingests data from multiple sources simultaneously, transforms it, and then sends it to a "stash" like Elasticsearch.
Kibana lets users visualize data with charts and graphs in Elasticsearch.
Environment:
Virtual machine 1
hostname: elk-master
ip address: 10.152.0.33
installed with : Elasticsearch, filebeat, logstash, kibana
Virtual machine 2 & 3
hostname: elk-data1 and elk-data2
ip address: 10.152.0.34 & 35
installed with : Elasticsearch
Install Elasticsearch on three nodes:
rpm --import https://artifacts.elastic.co/GPG-KEY-elasticsearch
wget http://artifacts.elastic.co/downloads/elasticsearch/elasticsearch-6.2.3.rpm
rpm --install elasticsearch-6.2.3.rpm
systemctl daemon-reload
systemctl enable elasticsearch.service
Edit “elasticsearch.yml” configuration on master node:
node.name: master1
node.data: false
network.host: ["localhost", "10.152.0.33"]
Start elasticsearch service:
systemctl start elasticsearch.service
systemctl status elasticsearch.service
Edit “elasticsearch.yml” configuration on data node1:
node.name: data1
node.master: false
network.host: ["localhost", "10.152.0.34"]
discovery.zen.ping.unicast.hosts: ["10.152.0.33"]
Edit “elasticsearch.yml” configuration on data node2:
node.name: data2
node.master: false
network.host: ["localhost", "10.152.0.35"]
discovery.zen.ping.unicast.hosts: ["10.152.0.33"]
Start elasticsearch service on both data nodes
Verify from less /var/log/elasticsearch/elasticsearch.log :
2019-08-12T08:22:54,971][INFO ][o.e.t.TransportService ] [data2] publish_address {10.152.0.35:9300}, bound_addresses {127.0.0.1:9300}, {[::1]:9300}, {10.152.0.35:9300}
[2019-08-12T08:22:54,983][INFO ][o.e.b.BootstrapChecks ] [data2] bound or publishing to a non-loopback address, enforcing bootstrap checks
[2019-08-12T08:22:58,348][INFO ][o.e.c.s.ClusterApplierService] [data2] detected_master {master1}{WRj0WpZfQVW5jiCg5nzvnQ}{-zQAViRrSASrA-94_LeUjg}{10.152.0.33}{10.152.0.33:9300}, added {{master1}{WRj0WpZfQVW5jiCg5nzvnQ}{-zQAViRrSASrA-94_LeUjg}{10.152.0.33}{10.152.0.33:9300},{data1}{ZuBdW3zPSpq0xhQgR8WGnA}{L7P8_nXcRMSGmsaZ7ySouw}{10.152.0.34}{10.152.0.34:9300},}, reason: apply cluster state (from master [master {master1}{WRj0WpZfQVW5jiCg5nzvnQ}{-zQAViRrSASrA-94_LeUjg}{10.152.0.33}{10.152.0.33:9300} committed version [6]])
[2019-08-12T08:22:58,412][INFO ][o.e.h.n.Netty4HttpServerTransport] [data2] publish_address {10.152.0.35:9200}, bound_addresses {127.0.0.1:9200}, {[::1]:9200}, {10.152.0.35:9200}
[2019-08-12T08:22:58,412][INFO ][o.e.n.Node ] [data2] started
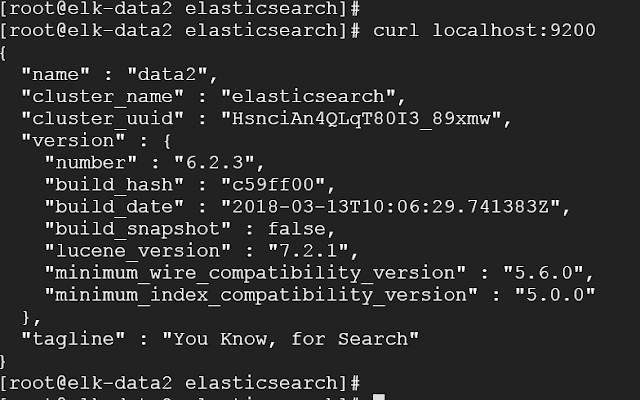
Verify on all nodes:
curl localhost:9200
curl localhost:9200/_cluster/health?pretty=true
Install Logstash on master node :
wget https://artifacts.elastic.co/downloads/logstash/logstash-6.2.3.rpm
rpm --install logstash-6.2.3.rpm
systemctl enable logstash
pipelines.yml configuration:
- pipeline.id: main
path.config: "/etc/logstash/conf.d/*.conf"
Download and copy sample apache conf file to /etc/logstash/conf.d/
wget https://github.com/linuxacademy/content-elastic-log-samples/raw/master/apache.conf
systemctl start logstash
systemctl status logstash
Verify logstash installation:
less /var/log/logstash/logstash-plain.log
Filebeat install and Ship Log Events on master node:
mkdir /var/log/apache2
cd /var/log/apache2
wget https://github.com/linuxacademy/content-elastic-log-samples/raw/master/access.log
wget https://artifacts.elastic.co/downloads/beats/filebeat/filebeat-6.2.3-x86_64.rpm
rpm --install filebeat-6.2.3-x86_64.rpm
systemctl enable filebeat
filebeat setup
vim /etc/filebeat/ filebeat.yml ( change as mentioned below )
#-------------------------- Elasticsearch output ------------------------------
#output.elasticsearch:
#hosts: ["localhost:9200"]
#----------------------------- Logstash output --------------------------------
output.logstash:
hosts: ["localhost:5044"]
Enable filebeat module:
filebeat modules enable apache2
Before starting filebeat make sure logstash, elasticsearch, and all nodes are up:
systemctl status logstash
systemctl status elasticsearch
curl localhost:9200/_cluster/health?pretty=true
If all ok than start filebeat:
systemctl start filebeat
systemctl status filebeat
Verify filebeat:
less /var/log/filebeat/filebeat
tail /var/lib/filebeat/registry
curl localhost:9200/_cluster/health?pretty=true
Kibana Install and Visualize on master node :
wget https://artifacts.elastic.co/downloads/kibana/kibana-6.2.3-x86_64.rpm
rpm --install kibana-6.2.3-x86_64.rpm
systemctl enable kibana
systemctl start kibana
systemctl status kibana
Check kibana status from log :
tail /var/log/messages
Kibana UI access (remote tunnal using ssh) from your laptop running with linux:
ssh root@<public ip> -L 5601:localhost:5601
Using browser open page: http://localhost:5601


